News
Best business partner for you-innovation company, Creative people
Position :
Home » News » Solar Traffic Sign Supplier » High Intensity Solar Power Dangerous Curve Rate
Hot Products
Company Profile

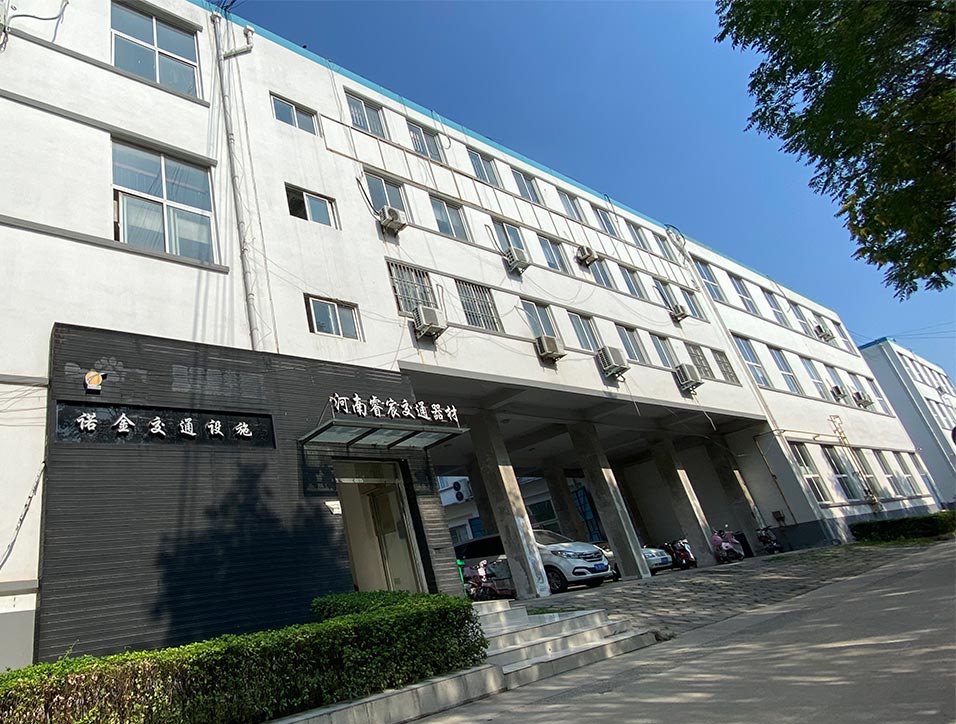
Shenzhen Nokin Traffic Facilities Co., Ltd

Founded in 2001, NOKIN Traffic is a professional manufacturers which is involved in design, research & development, production and marketing in safety industry. The main products are solar traffic signs, solar road studs, solar street lights and road marking machines.
View More +
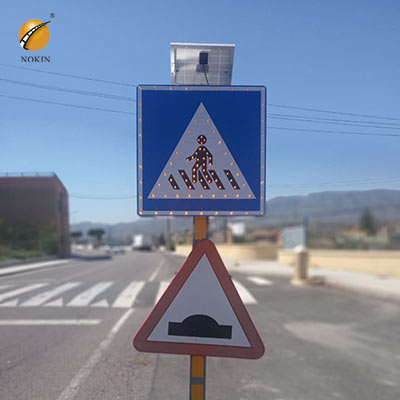
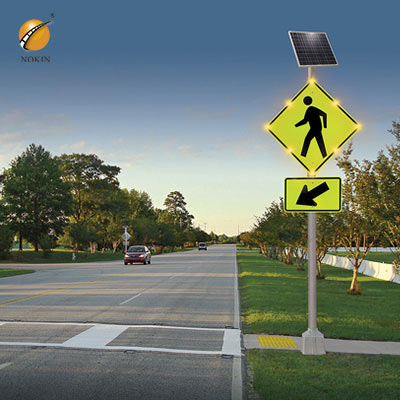
NOKIN solar powered crosswalk signs in Spain

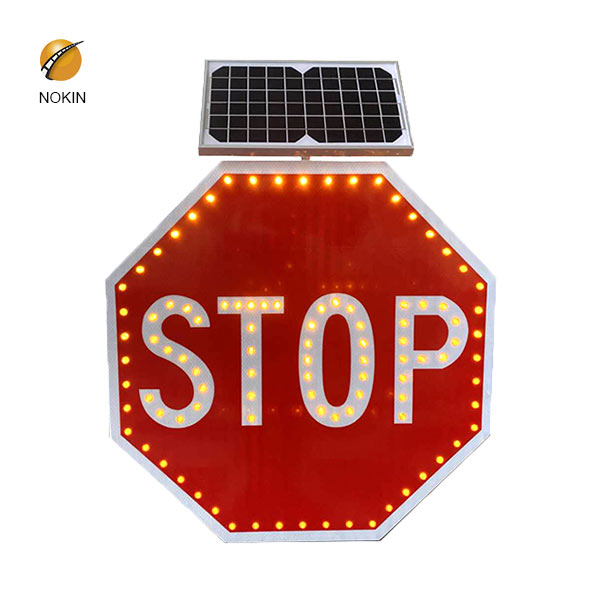
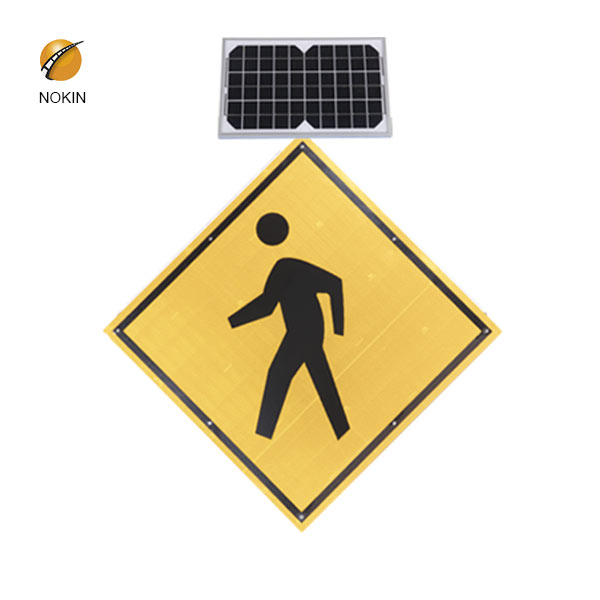
During the day, solar panels in Solar pedestrian crossing signs absorb sunlight, convert the solar energy into electrical energy, and store it in the energy storage device. At night, the electrical energy in the energy storage device is automatically converted into light energy (controlled by a photoelectric switch) and emitted through LEDs. Bright light to outline the pattern and convey traffic information. It gives road users exact road traffic information.

View More +
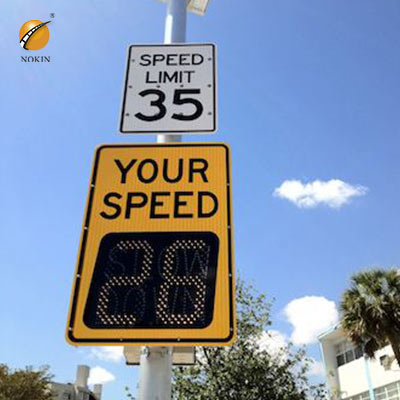
Radar speed limit signs: The new star of radar speed measurement

Radar speed limit signs are a new thing, and the accuracy of this technology is also the focus of people’s attention and the focus of enterprises. How to accurately capture the speed information of the vehicle is something that people are eager to know. NOKIN has made new improvements in radar sensors, transmission schemes and system operation.

View More +
LED Solar traffic signs – a good helper on the road at night

The existence of LED solar traffic signs on the road at night fully reflects the new concept of people-oriented traffic safety. It can be said that the personal safety of drivers and the safety of road facilities are guaranteed to a certain extent. The best choice for LED solar traffic signs is to choose manufacturers with excellent quality and perfect brands.

View More +
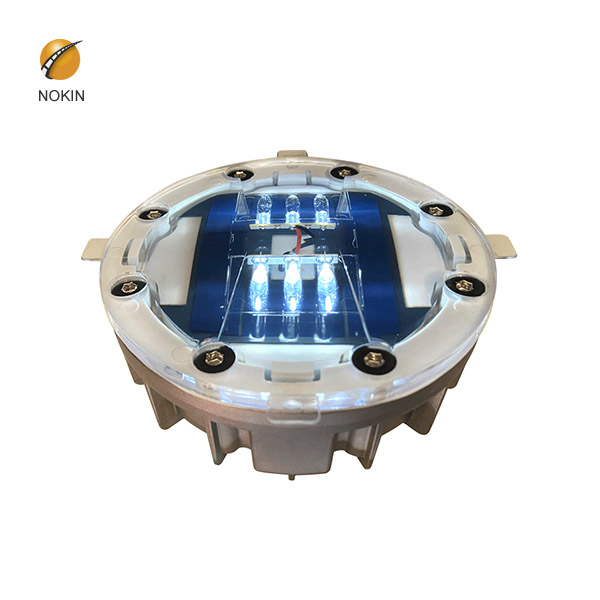
Ultra Thin Solar Road Stud Lights Were Installed In Brazil
Good news from Nokin Traffic than our ultra thin solar road stud lights Q7 was installed in Brazil. Solar road stud lights NK-RS-Q7, this is an ultra-thin solar road stud, our Brazil customers bought them and used them for garden roads, this cat’s eye lamp is only 11mm thick, IP68 waterproof, five colors for you Choice, if you have a private garden and need decorative lights, this is a better choice. This ultra-thin solar road stud light was originally designed for bicycle lanes a...
View More +
Inquiry
Name
Email
*
Phone
*
Country
Message
Solar Radiation in Space | PVEducation

Solar Radiation in Space | PVEducation

At a distance, D, from the sun the same amount of power is spread over a much wider area so the solar radiation power intensity is reduced. In the calculation below the radiant solar intensity at the sun’s surface, H sun is 64 × 10 6 W/m 2 and the radius of the sun, R sun , is 695 × 10 6 m.

Quote Now
Exceptionally strong variation of galactic cosmic ray intensity

Exceptionally strong variation of galactic cosmic ray intensity

Solar rotation, the source of 27-day recurrence of GCR intensity, is not rigid, but differential, i.e. at various latitudes the rate of rotation is different. There are still many open questions about

Quote Now
Concentration Ratio - an overview | ScienceDirect Topics

Concentration Ratio - an overview | ScienceDirect Topics

However, because the intensity of solar radiation varies throughout the day and is hard to measure, it is not easy to obtain the concentration ratio using that equation. To simplify the research problem, the concept of the geometrical concentration ratio was introduced, which is defined by the ratio of the light aperture area to the receiver area, i.e., ( Eq.

Quote Now
Electromagnetic Fields and Cancer - National Cancer Institute

Electromagnetic Fields and Cancer - National Cancer Institute

Sermage-Faure C, Demoury C, Rudant J, et al. Childhood leukaemia close to high-voltage power lines--the Geocap study, 2002-2007. British Journal of Cancer 2013; 108(9):1899-1906. [PubMed Abstract]

Quote Now
California Solar Energy Statistics and Data

California Solar Energy Statistics and Data

In 2020, solar PV and solar thermal power plants produced 29,440 gigawatt-hours (GWh) of energy or 15.42 percent of California's in-state generation portfolio. A total of 770 operating Solar power plants, with an installed capacity

Quote Now
Part 2: Solar Energy Reaching The Earth’s Surface | ITACA

Part 2: Solar Energy Reaching The Earth’s Surface | ITACA

2.1. The Solar Constant The Sun is considered to produces a constant amount of energy. At the surface of the Sun the intensity of the solar radiation is about 6.33×10 7 W/m 2 (note that this is a power, in watts, per unit area in meters). (note that this is a power, in watts, per unit area in meters).

Quote Now
PV Inverters - Basic Facts for Planning PV Systems | SMA Solar

PV Inverters - Basic Facts for Planning PV Systems | SMA Solar

The power characteristics curve of a PV module is strongly dependent on the radiation intensity and the temperature of the module – in other words, on values that continually change over the course of the day. For this reason, the

Quote Now
Utility-Scale Solar Photovoltaic Power Plants

Utility-Scale Solar Photovoltaic Power Plants

cost of solar PV power plants (80% reduction since 2008) 2 has improved solar PV’s competitiveness, reducing the needs for subsidies and enabling solar to compete with other power generation options in some markets. While

Quote Now
Intensity or photon flux - PV Lighthouse

Intensity or photon flux - PV Lighthouse

The amount of radiation can be quantified in various ways. In photovoltaics, we usually use either light intensity, also called energy flux or irradiance, which is energy per area per time, typically [W/m 2] or [mW/cm 2]; or Figure 1: The AM0 spectrum, where spectral irradiance (top) and the photon flux (bottom) are plotted against wavelength (left) and photon energy (right).

Quote Now
GOES X-ray Flux | NOAA / NWS Space Weather Prediction

GOES X-ray Flux | NOAA / NWS Space Weather Prediction

2021/05/09 · GOES X-ray flux measurements (1 - 8 Angstrom flux) have been made since 1986 and, prior to that, on the NOAA SMS satellites since 1974. SWPC has used this data to produce the 1-minute and 5-minute averaged X

Quote Now
Solar Simulation - Spectral Irradiance - AM0-AM40 | AM1.5G

Solar Simulation - Spectral Irradiance - AM0-AM40 | AM1.5G

2021/04/29 · With the development of high power LED technology in the 1990s, solar simulators were developed to use this new light source, which offered advantages such as tunable spectra, high accuracy, long operating life, and output . ,

Quote Now
The Economics of Solar Power - Investopedia

The Economics of Solar Power - Investopedia

2021/05/19 · Economics of Solar Power Though renewable energy represents a fraction of total energy consumed, the U.S. is the leading consumer of renewable energy. Yet, despite the increase of available solar

Quote Now
Deep solar minimum on the verge of an historic milestone

Deep solar minimum on the verge of an historic milestone

2019/12/13 · Solar cycle 25 The solar cycle is like a pendulum, swinging back and forth between periods of high and low sunspot number every 11 years or so. Researchers have been tracking solar cycles since they were discovered in the

Quote Now
Confronting the Duck Curve: How to Address Over-Generation

Confronting the Duck Curve: How to Address Over-Generation

2017/10/12 · In 2013, the California Independent System Operator published a chart that is now commonplace in conversations about large-scale deployment of solar photovoltaic (PV) power. The duck curve—named after its

Quote Now
Visualizing the Copper Intensity of Renewable Energy

Visualizing the Copper Intensity of Renewable Energy

2021/05/20 · Copper is one such mineral, which stands out due to its critical role in building both the technologies as well as the infrastructure that allows us to harness their power. The above infographic from Trilogy Metals highlights the role of copper in renewable energy, and how the adoption of wind and solar energy will affect its demand going forward.

Quote Now
Inquiry
Name
Email
*
Phone
*
Country
Message